List & Label Reporting Blog
New Service Pack 30.004 for List & Label and the Report Server
Combine Different Projects into One Print Job
New Service Pack 25.003 for List & Label and the Report Server
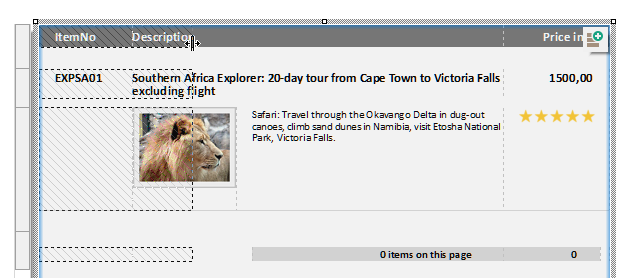
Powerful, Reusable Subreports for Your Reports
Often reports consist of similar, repetitive sections like a number of charts or crosstabs just filtered for different categories but otherwise identical. Or tables and subtables that have a preselected set of columns you want to have wherever this table is used. List & Label 26 now helps you and your users to get rid of the tedious task to maintain such reports and apply changes to all instances of objects. You can add real subreports that contain exactly the required items and maintain those in one single place.
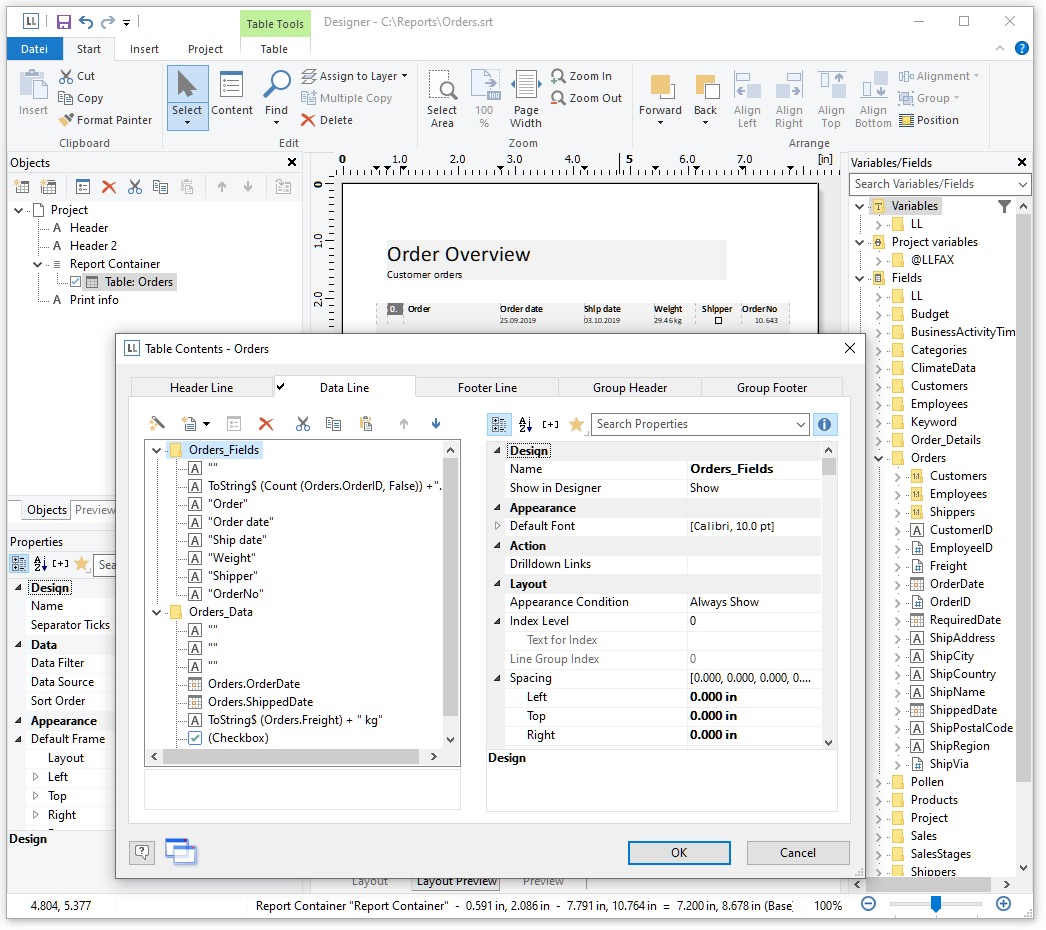
List & Label 26 Preview: New Drag & Drop Features for the Table
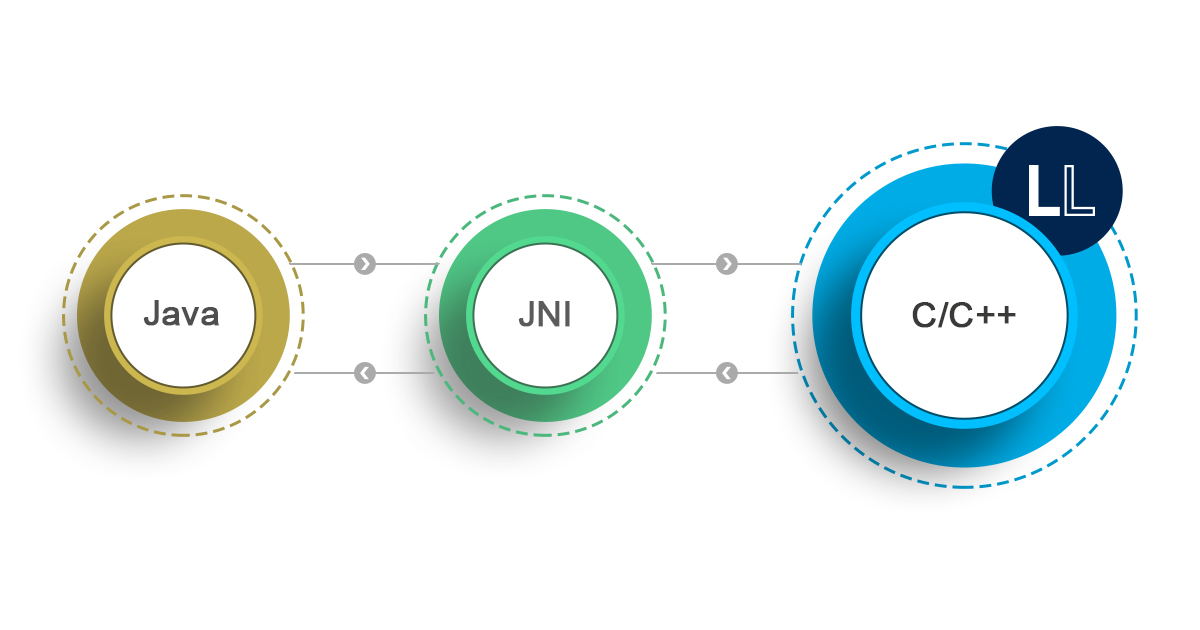
Java Native Interface (JNI) for List & Label available on GitHub

New Service Pack 25.002 for List & Label and the Report Server
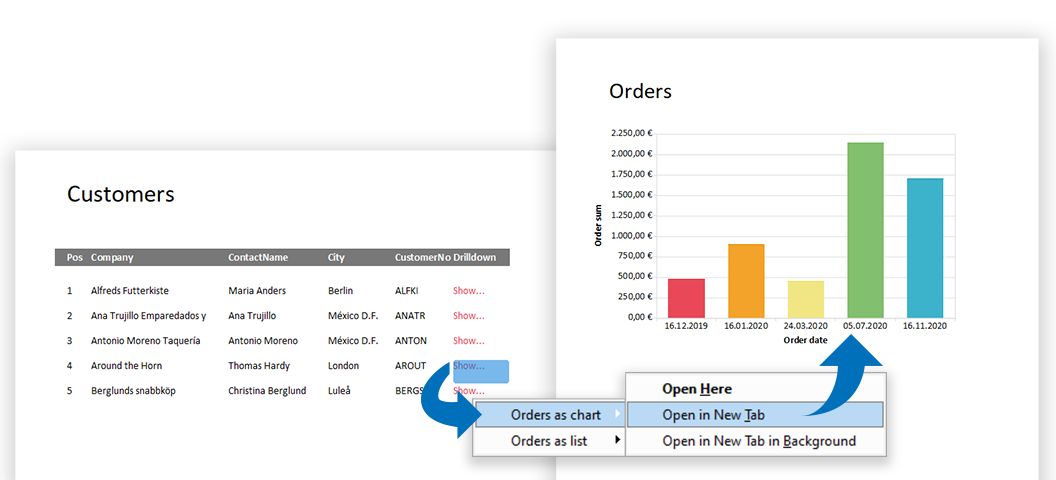
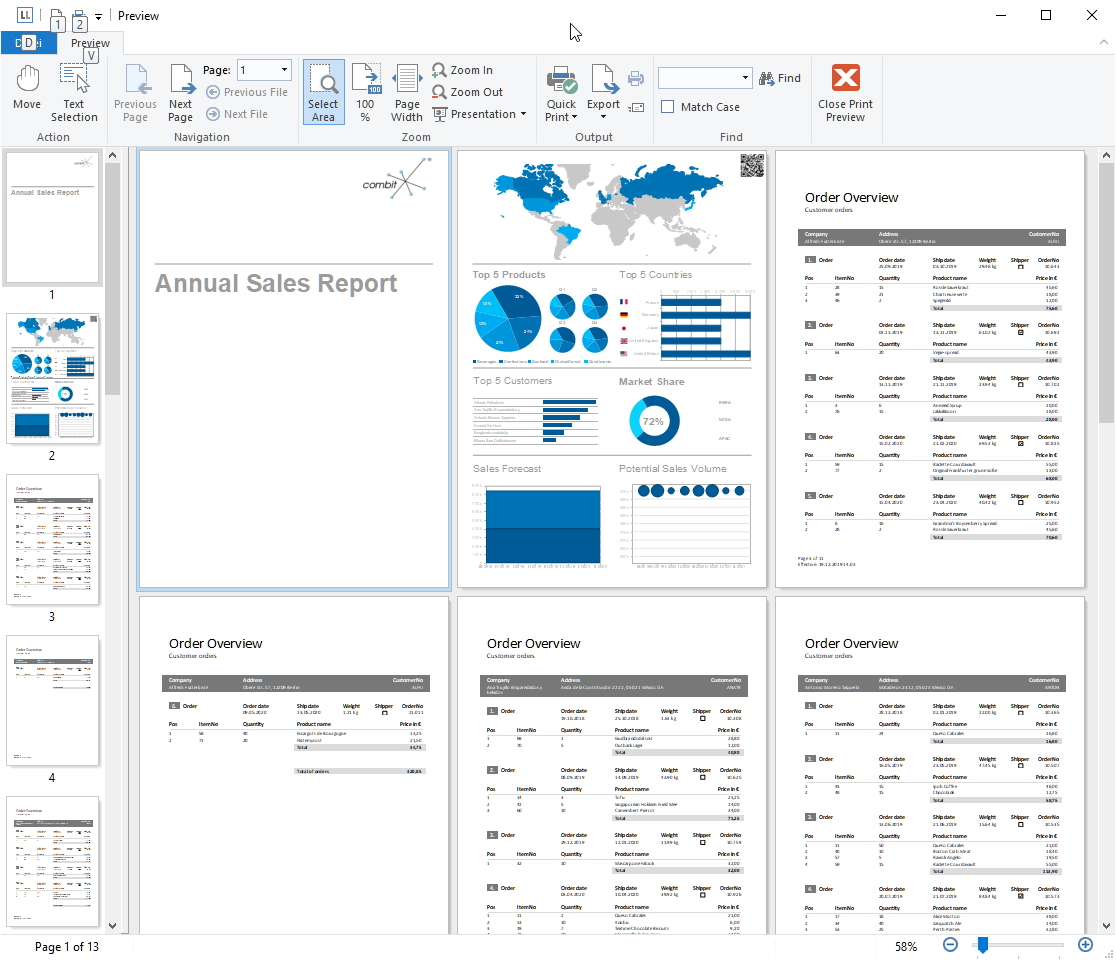
Interactive Reports with List & Label
Today, modern reports must be designed for more than just one purpose. In addition, "all" data should be contained as simply as possible – but presented in a clear and structured way. With List & Label such multifunctional reports can be easily realized. Interactive elements allow a single report to cover several scenarios, while selection options further enhance the report. This makes reports more comprehensive and informative and can be easily operated by the user.
Service Pack 25.001 for List & Label and Report Server
Miscellaneous Treats in List & Label 25