List & Label Reporting Blog

A High Level of Satisfaction and New Ideas: Insights from our List & Label Customer Survey 2024
Back in March, we conducted our annual customer survey to gain deeper insight into the satisfaction and needs of our developer community. The results were extremely pleasing and revealing towards our aim to continuously develop List & Label and our services. Of course, we’d like to share them with you.
Our Most Popular Resources for Developers
Let's be honest, developing has it's challenges. To meet the ever more diverse demands on applications and technologies, we all rely on a multitude of ressources to make our lives easier. So we, the makers of your favorite reporting tool, thought it's about time to let you benefit from our experience. Below you will find just a small selection of the tools that we can't do without.
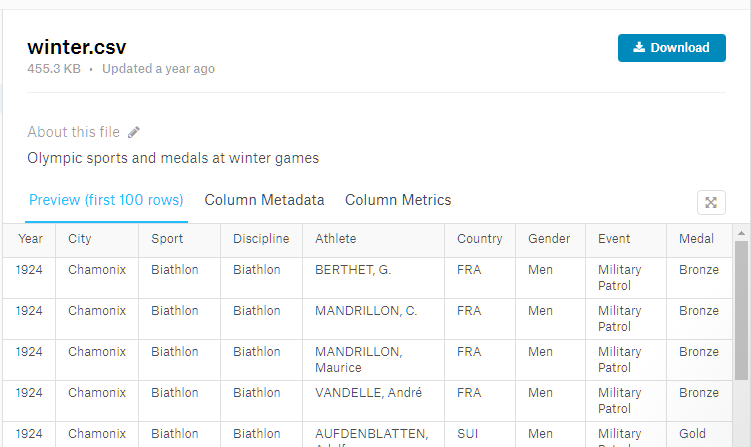
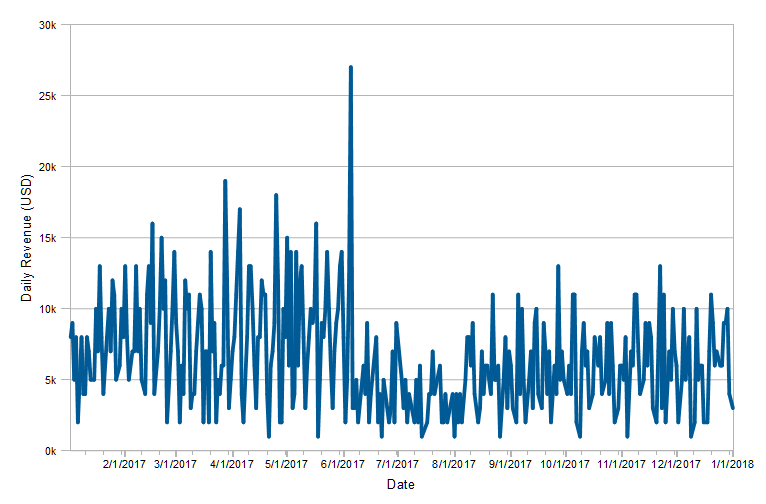
Fun With the Major Upcoming Winter Sports Event in Pyeongchang
As you might know, this year’s Winter Sports Event will start just by the end of the week. I have to circumlocate the actual name of the event as those people really mean “Trademark” when they say it. Let’s call it simply “Games” for the rest of this article, which hopefully should be safe. Anyway, I thought this would be a good opportunity to do some statistics with my favorite reporting tool.
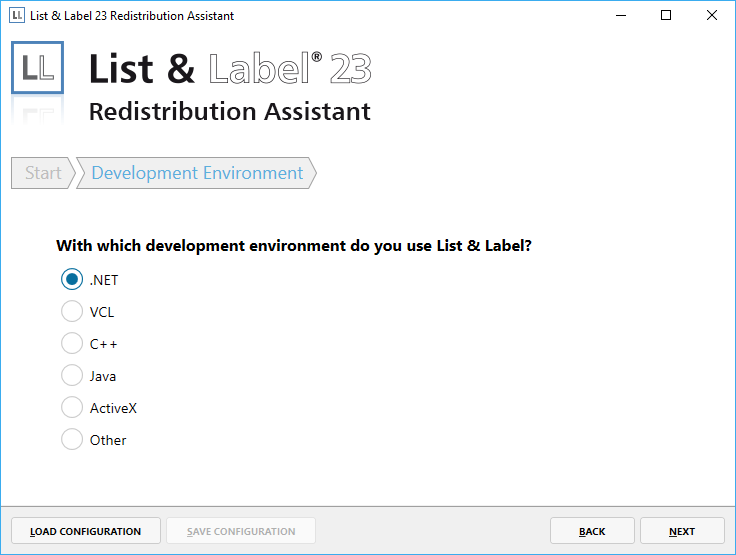
Simple List & Label Redistribution with New Assistant
The compilation of the redistributable files of List & Label has been somewhat cumbersome so far. But we listened to the wishes of our customers and developed an easy-to-use redistribution assistant.
Miscellaneous Treats in LL23
While holiday season is approching fast, bringing some well-deserved quality time off work for all of us, I briefly wanted to share some miscellaneous treats in version 23 of our List & Label reporting tool with you.
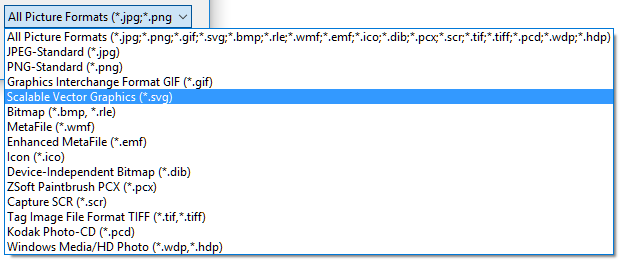
Supporting SVG as Image Format
The Scalable Vector Graphics format has been around for quite a while. The first specification was released in 2001, and meanwhile all browsers offer solid support for SVG. During the years, we've received a couple of requests to support SVG in List & Label. Initially, I was hoping for Microsoft to make SVG rendering support a Windows feature that we could just use. However, that hasn't happened so far. And so we had to come up with a different solution.
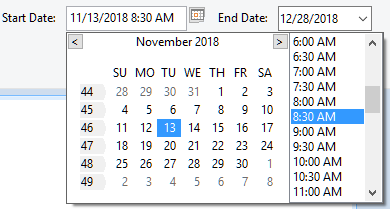
Signal Ranges Extended to Charts
The signal ranges are a handy gauge feature to highlight parts of the scale. It enables you to divide the scale e.g. into a green, yellow and red part. That way, you can judge at a glance if a value is "good" or "bad". In LL23, this feature has been extended to charts.
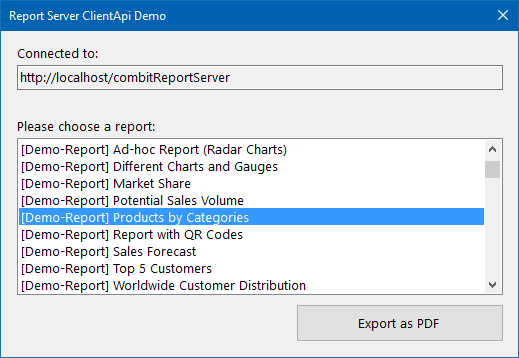
Brand-New Component: „combit.ReportServer.ClientApi“
Have you ever wanted to migrate your List & Label projects and data providers to a central webserver to export and view them on an Android or iOS tablet with just a few lines of code? With the upconing new version 23 we have some good news for you!
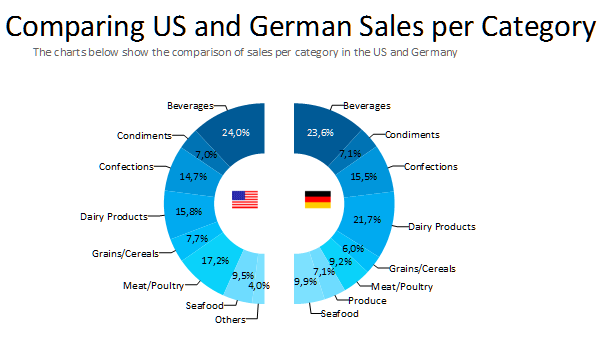
New Layout Options for Pie Charts and Donuts
After adding a number of new chart types in the last versions, most notably Radar, Treemap, Shapefile and Funnel charts, we're adding a small yet very neat property for pie and donut charts to List & Label 23: pie coverage. This allows to define if the pie should consist of a full circle or just parts of it.
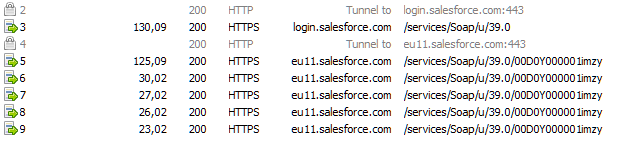
Easily Connecting to Salesforce Data
No matter which data, using the DataProvider interface you can write your own custom binding. And of course we ship a whole family of providers with List & Label. In LL23, there's a new member of this family that allows your applications to connect to Salesforce data easily.

Supporting Cross-Datasource Relations
The .NET DataProvider concept allows to bind to almost any data source. Basically, it mimics a relational database management system containing tables, relations, sort orders etc. However, often you'll find yourself needing to combine data from different sources, e.g. a server log file that contains customer logins and a SQL customer database that contains all pertinent information about the customers.