List & Label Reporting Blog
Introducing Adjacent Crosstabs for Multi-Dimensional Data Analysis
Crosstabs are a very popular object within the List & Label Designer, that’s why we’re continuously adding enhancements to this important features. So far though, despite all added extensions, crosstabs have ultimately been a simple grouping in two dimensions. From version 29 on, they’ll become more dimensional.
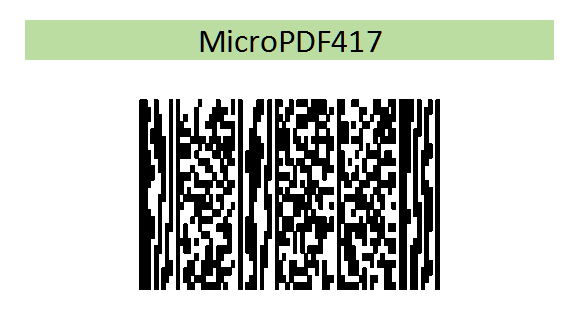
Support for MicroPDF417 and Codablock-F. Barcodes
List & Label's barcode support is surely one of the best and most complete among the reporting tools on the market. We've been steadily working on further extending on that strength, and List & Label 22 will come with even more supported symbologies and barcode designer functions.
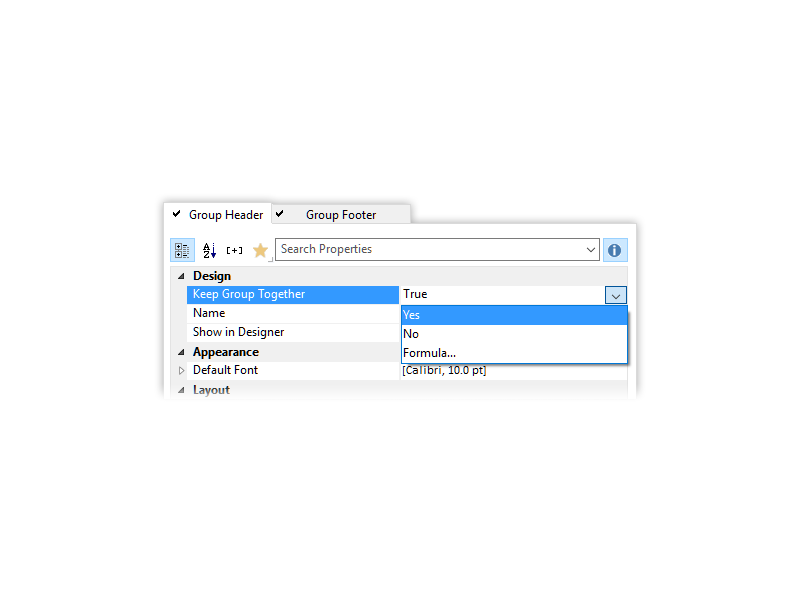
Keeping Groups Together in Report Outputs (.NET, C++)
Sorry for the gonzo title of this blog post – I just couldn't resist. I actually started working for combit in 1998 which is a full 18 years ago. And this is the feature I was asked for the most. No kidding. From the early days, way before we had the report container, people wanted this one thing – keep groups together. The reasoning is simple, if you have rather short groups but a huge number of them, you don't want page breaks within one group but rather get a page wrap before the group header and then the whole group on the next page. Totally simple, totally understandable, totally impossible so far.
Query Assistant and Filtering in Report Server 3
Our combit devblog is always in motion. This time, Alexander Horak, Head of Development combit Report Server, takes the opportunity to present one of the great features of our awarded self service reporting solution. In his post he puts the focus on a new way of data filtering, that has been introduced with the release of version 3 a few weeks ago.
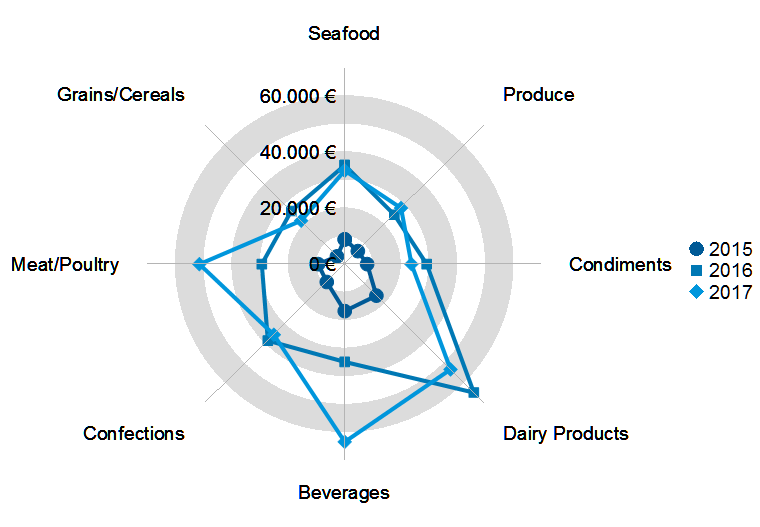
Introducing Radar Charts as New Chart Type
We'll introduce a brand new popular chart type that has been missing in List & Label until version 22: radar charts. Also known as "spider charts", "web charts" or "polar charts", they are a cool way to visualize ratios between different categories across multiple rows. It can answer questions like "which values are most similar, i.e. do we see clusters of values" and helps to find outliers at a glance.
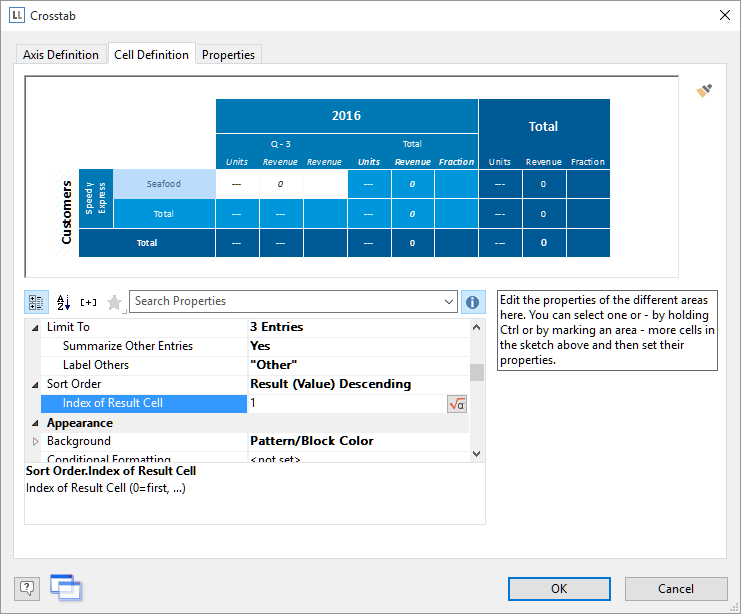
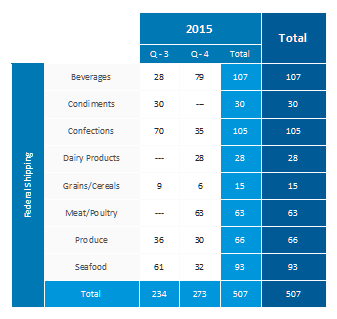
Top-N and “Others” for Crosstabs
And while we're at it, let's disclose the last new feature for LL22's crosstab. You were able to design Top-N reports with the crosstab before. The way it works, you choose the required sorting for your group cells, e.g. the category name in the sample of the last post. You're then able to choose the sort order for the items (alphabetically, based on the result value, based on the displayed value).
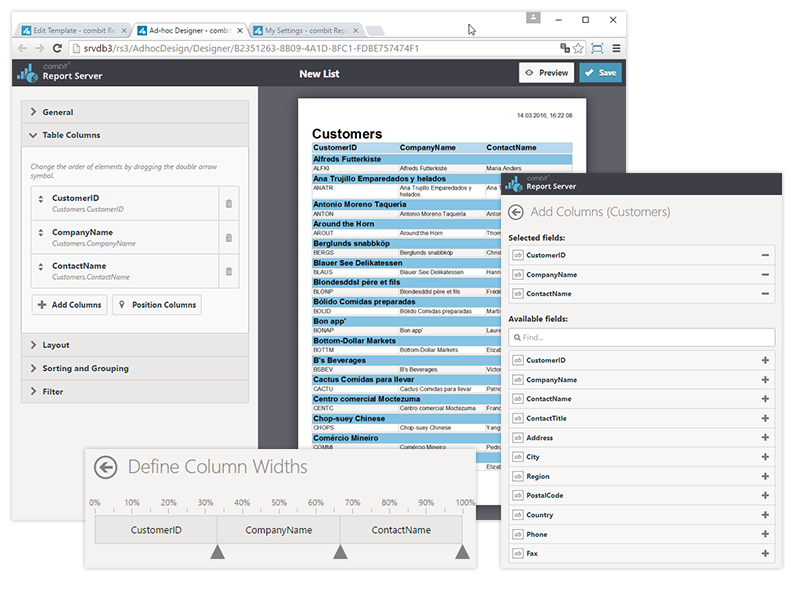
Lightning-fast Ad-hoc Design with Report Server 3
With combit Report Server 3, you now also have the ad-hoc Designer in addition to the design features from previous versions. Ad-hoc Design wizards enable you to create lists and diagrams (charts) quickly and easily. This combination equips the reliable and powerful Report Server with a quick and streamlined interface that is perfect for generating simple reports. The interface of the new wizards has also been optimized for devices that support touch-screen technology, which allows it to be easily operated on tablet devices as well.
Automatic Fill-Up for Crosstabs
To continue the quest for the perfect crosstab, welcome to part three of this blog post series. After visiting multiple result cells and cross-column references, today let's look at another cool new feature in the LL22 crosstab – Auto-Fill. This comes in handy whenever there is few data. Think of a yearly statistic where you don't have results for each quarter. Printing something like Q1…Q2…Q4 looks awkward and unprofessional. In LL22 we have the solution to this.
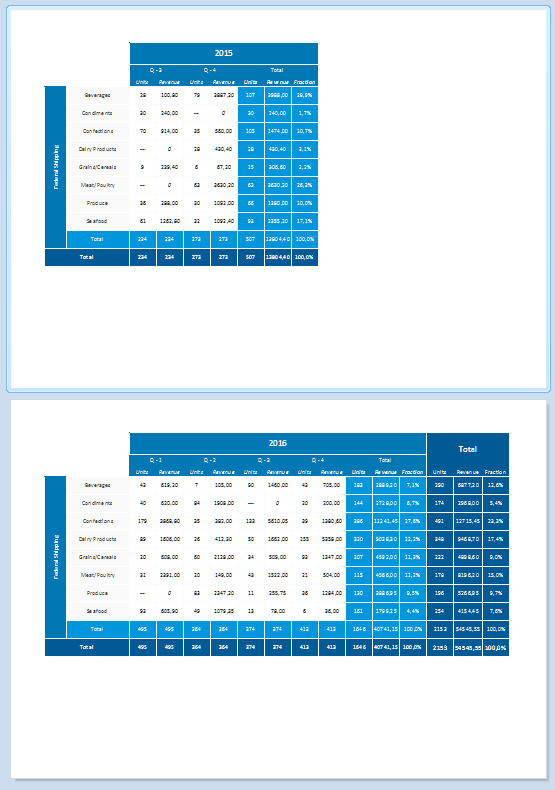
Cross-Row and Column References for Crosstabs
From the latest blog post you could already tell that the crosstab is one of our focus areas for version 22. Besides multiple result cells
we decided to pay a visit to the crosstab functions as well. In version 21 these functions can already be used to reference the values of sum cells, column and row labels etc. By extending the functions slightly, striking new features become available.
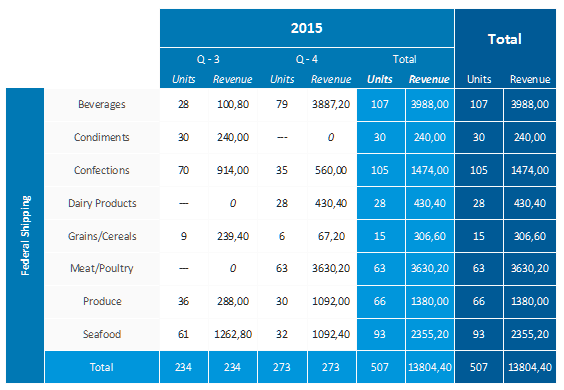
Enabling Multiple Result Cells for Crosstabs
As this was one of the most frequent requested features in our feedback portal and we hadn't visited the crosstab's features for a couple of versions, this feature was an easy pick. A crosstab is aggregating values and groups them by two or even more dimensions. Until version 22, there was exactly one aggregation possible, e.g. you could have either the number of orders or the revenue sum per customer and year, not both. In LL22, there is no limit anymore.
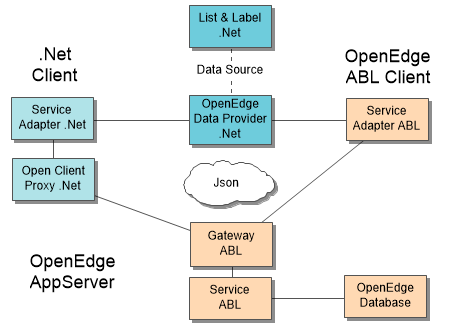
Progress OpenEdge Reporting Tool List & Label 21
This time we feature a guest post from our partner and developer colleague Thomas Wurl. About two years ago, Thomas developed a free data provider for Progress OpenEdge available for all List & Label customers. While this provider was adopted successfully by many Progress users, it suffered some restrictions. So Thomas decided to restart from scratch and came up with an incredibly fast and powerful new solution. Here's his story.