List & Label Reporting Blog
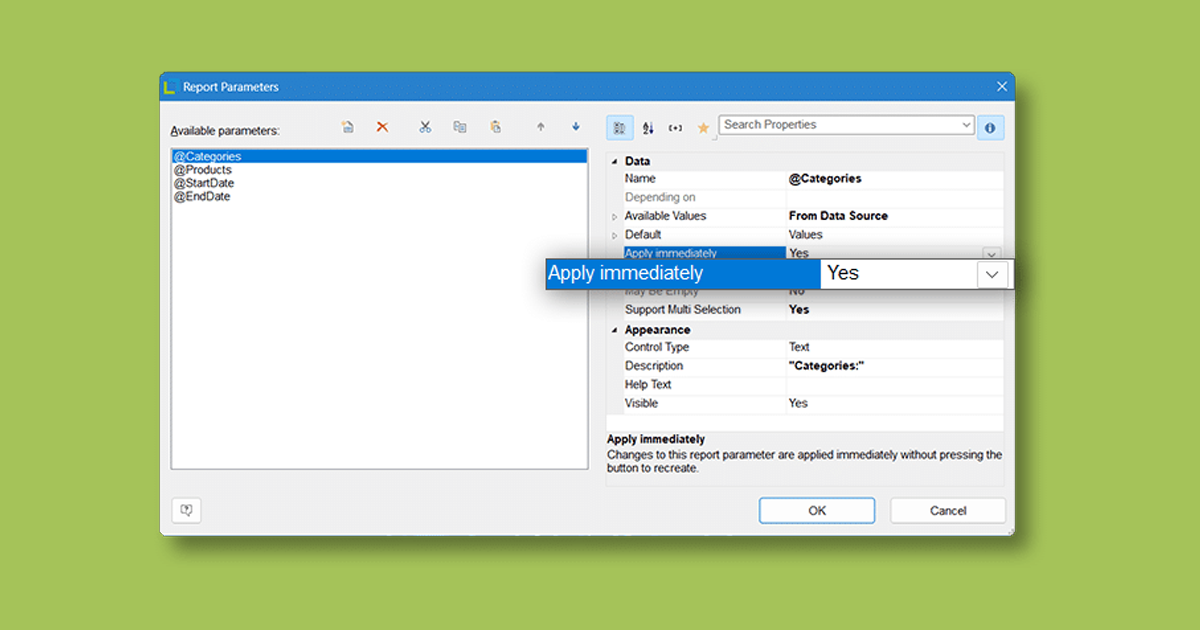
“Apply immediately” – new property for report parameters
With the new “Apply immediately” property for report parameters, you no longer have to click “Refresh” manually every time: as soon as you change a parameter with this option enabled, List & Label automatically re-renders your report. It saves you time, streamlines your workflow, and delivers an intuitive user experience—both on desktop and on the web.
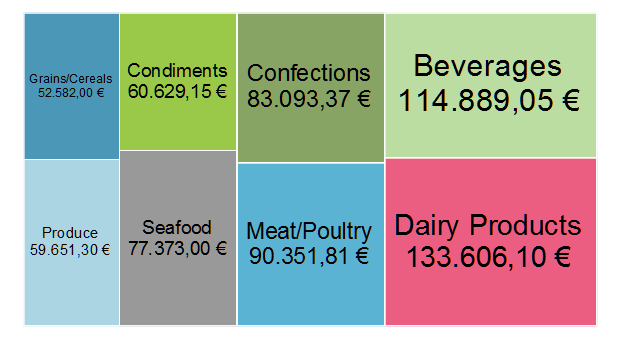
The Treemap Chart Experience
With Treemap charts you can visualize hierarchical data by using nested rectangles in the upcoming version 22 of our List & Label reporting tool. The area of each rectangle is proportional to its value, while the sum of all rectangle areas fills up the whole chart area.
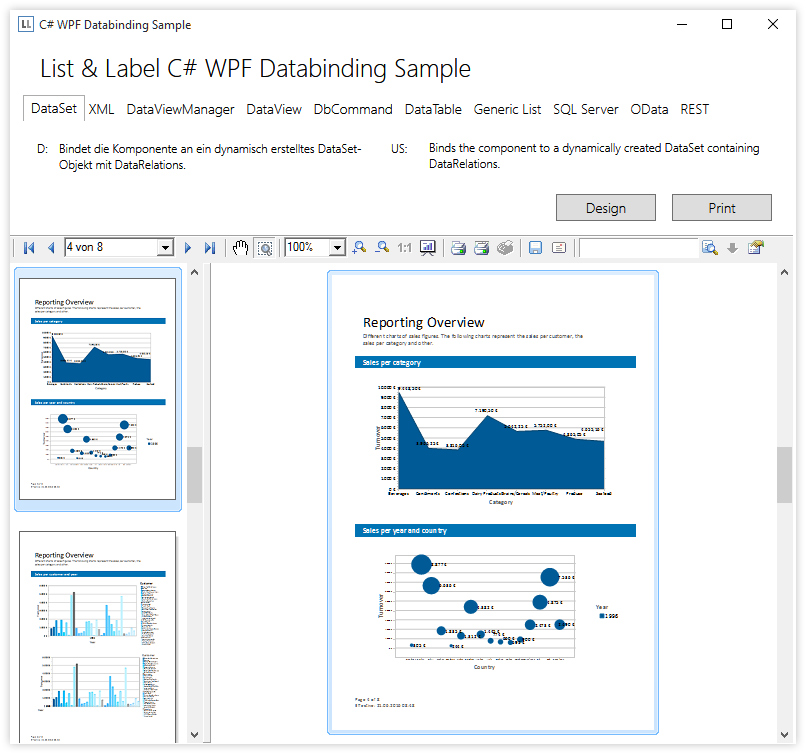
WPF Wrapper for PreviewControl
Version 22 of List & Label will introduce a new WPF wrapper control for the existing WinForms PreviewControl. While it uses a WindowsFormsHost at the core, the wrapper is a drag & drop replacement for the existing WPF preview control which will continue to be supported.
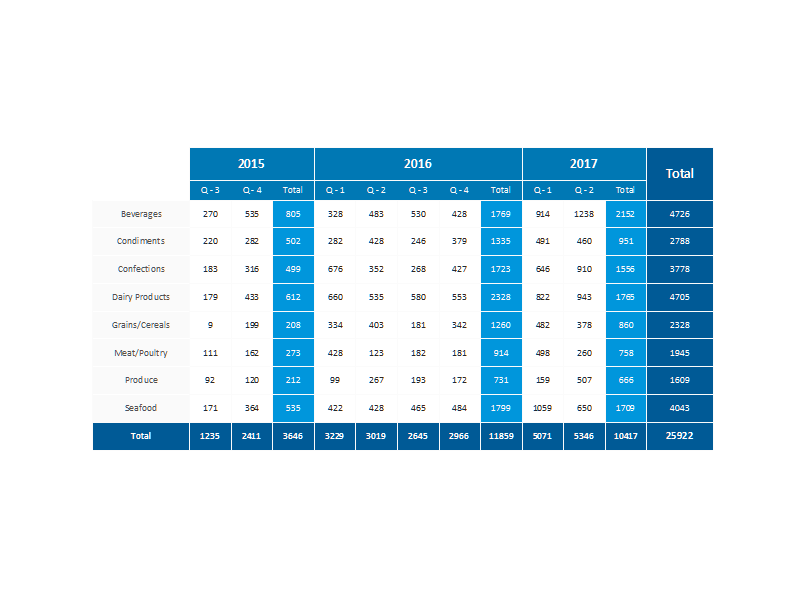
Crosstabs: Expand Sub Tables in the Interactive Preview
As we swiftly proceed through the development process of List & Label 22, we found a slot to add one more feature to the crosstab. Starting in version 19, we've added a lot of interactivity to the preview, including a feature called "Expandable Regions" for the report container. It allows to expand sub tables by just a click. For LL22, we've now extended this feature to the crosstab.
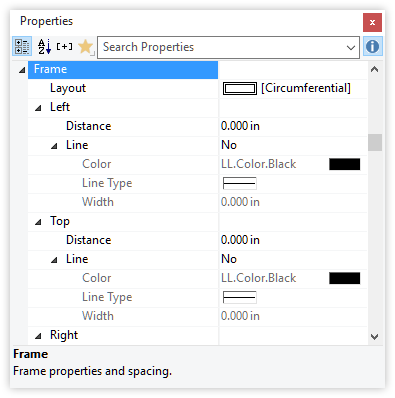
Select Your Property Favorites
This is one of the major UI visible changes in LL22. All objects have their distinct set of properties which is displayed in the property window. Depending on the complexity and flexibility of the object, the list of properties is quite long where most of the time you probably don't need 50% of them. Enter the new Property Favorites.
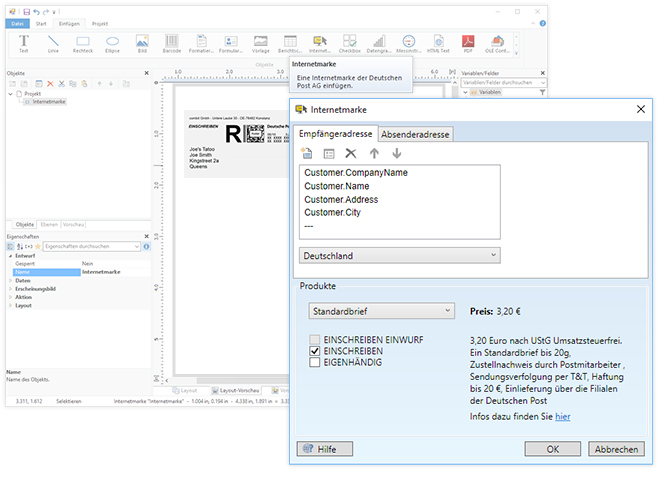
Intelligent Franking with Internetmarke
The process of getting snail mail ready for posting can be rather tiresome. You print your letters or invoices, enjoying the fine work you have done designing them in List & Label, and then? Even in our modern times you lick the stamp, assuming you have the right one at hand, and stick it on the envelope. How very old-school is that? With the upcoming version 22 of List & Label this process can be elegantly automated through Internetmarke, a service to pay for postage online by German courier company Deutsche Post AG.
Service Pack Continues Report Server Success Story
Service Pack 3.001 adds a host of new features to combit Report Server 3. Some improvements in our enterprise reporting solution were inspired by the productive feedback from our customers. Thanks for letting us know about your ideas! Here’s a short list of the latest features and improvements.
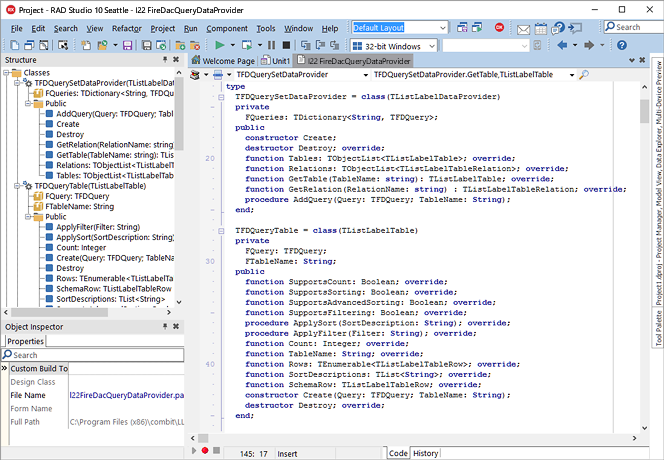
Building a Better Databinding Ecosystem for Delphi
The IDataProvider interface for .NET has enabled many features that are not available for all of the other platforms so far. Most importantly, it brings multiple report containers and nested tables. For C++, we’ve included a sample in LL21. This is sadly missing in Delphi. In addition, the current Delphi data-binding engine still works against the BDE, a technology that has been deprecated quite a while ago by Embarcadero.
Support for MicroPDF417 and Codablock-F. Barcodes
List & Label’s barcode support is surely one of the best and most complete among the reporting tools on the market. We’ve been steadily working on further extending on that strength, and List & Label 22 will come with even more supported symbologies and barcode designer functions.
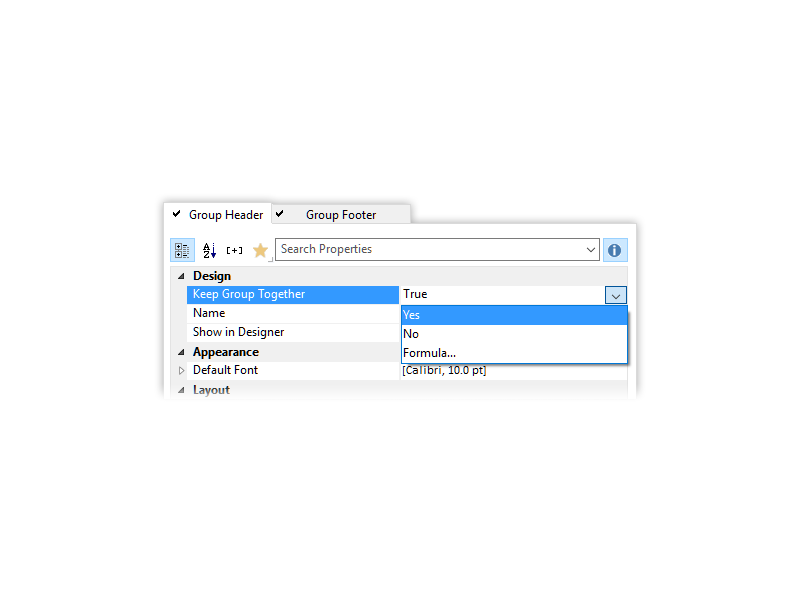
Keeping Groups Together in Report Outputs (.NET, C++)
Sorry for the gonzo title of this blog post – I just couldn't resist. I actually started working for combit in 1998 which is a full 18 years ago. And this is the feature I was asked for the most. No kidding. From the early days, way before we had the report container, people wanted this one thing – keep groups together. The reasoning is simple, if you have rather short groups but a huge number of them, you don't want page breaks within one group but rather get a page wrap before the group header and then the whole group on the next page. Totally simple, totally understandable, totally impossible so far.
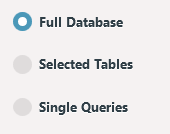
Query Assistant and Filtering in Report Server 3
Our combit devblog is always in motion. This time, Alexander Horak, Head of Development combit Report Server, takes the opportunity to present one of the great features of our awarded self service reporting solution. In his post he puts the focus on a new way of data filtering, that has been introduced with the release of version 3 a few weeks ago.


