List & Label Reporting Blog
Enhanced Drag & Drop Support in the Designer
Great new Features for .NET Developers
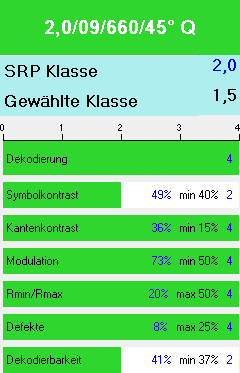
Four Steps We Took to Improve Our Barcode Printing Quality
Through a cooperation with REA, a renown vendor of barcode verifiers, we were able to grade and improve our barcodes according to the usual ISO standards. Amongst other optimizations we completely changed the rendering algorithm to optionally match the bars exactly to the device pixels, eliminating all rounding effects this way. Typically, at least a grade of "B" is required by barcode consuments. This should now be easily achievable on typical hardware.
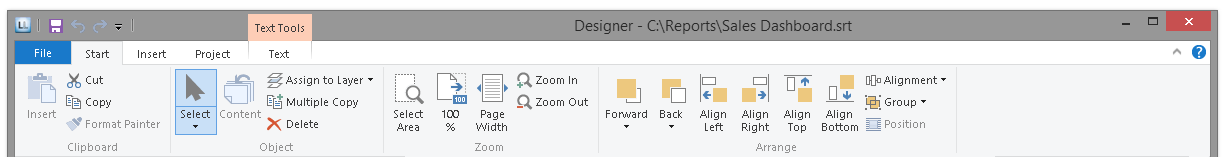
Office 2013 Style for the Ribbon UI
The Ribbon interface has been adapted to Redmond's latest UI style. It now supports the Office 2013 flat icon style and thus blends nicely with modern applications. For those who really need it, we still ship the "old" interface in a sepatate resource file that can be used instead of the default.
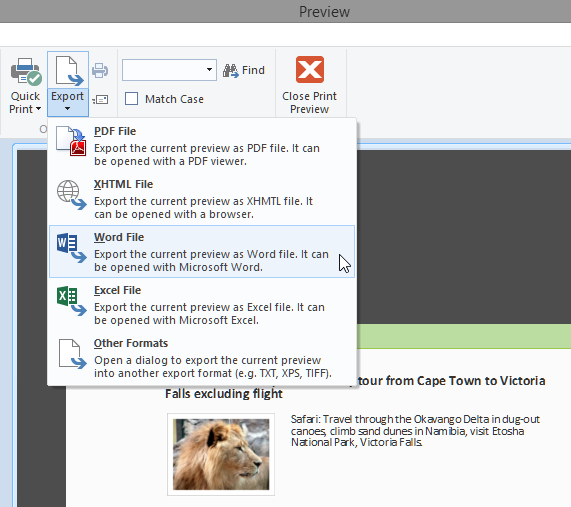
Export to Excel, Word and XHTML from the Preview Window
Supporting to Paste Formattings Between Objects
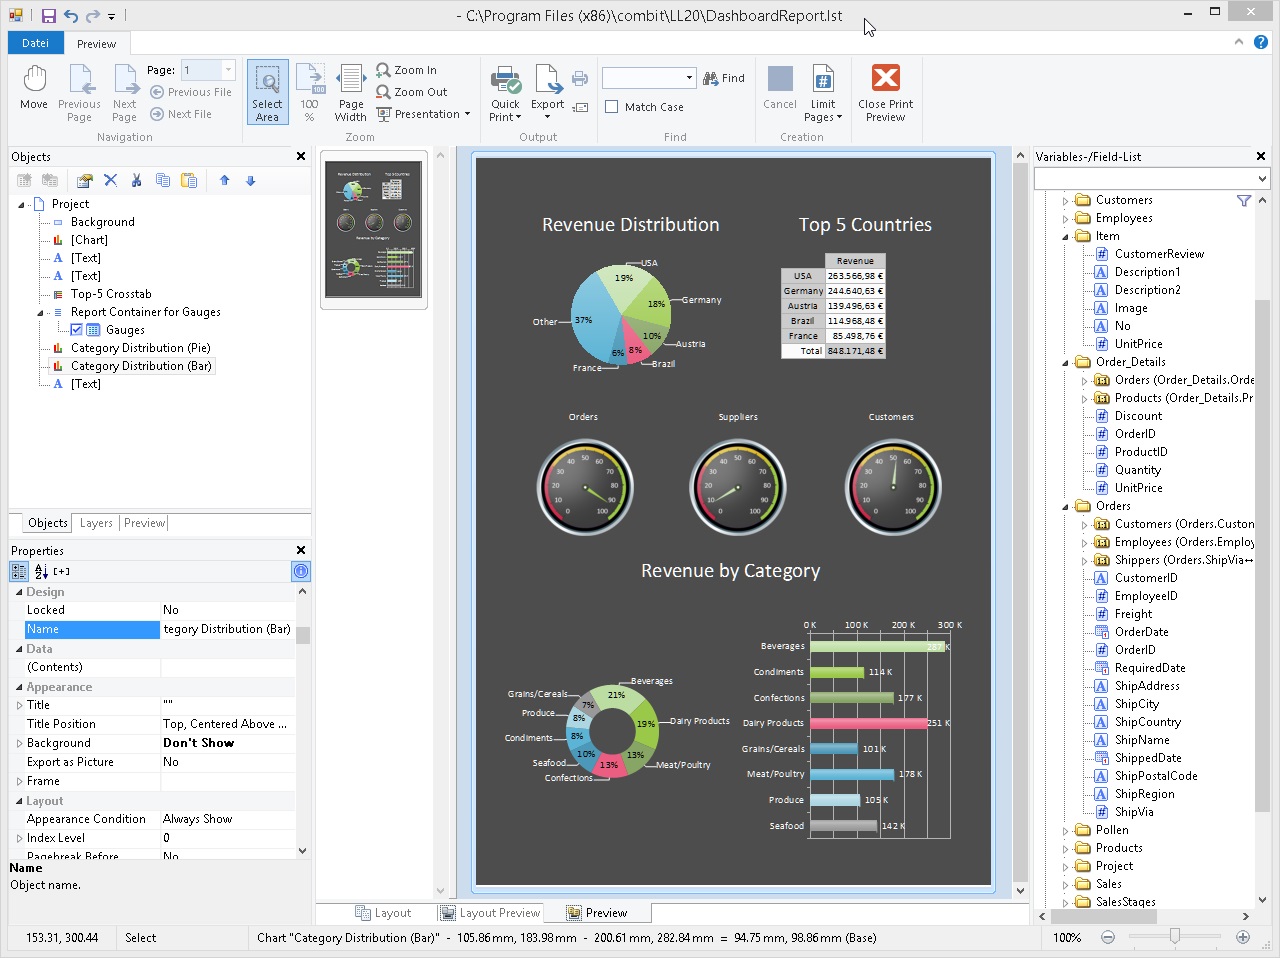
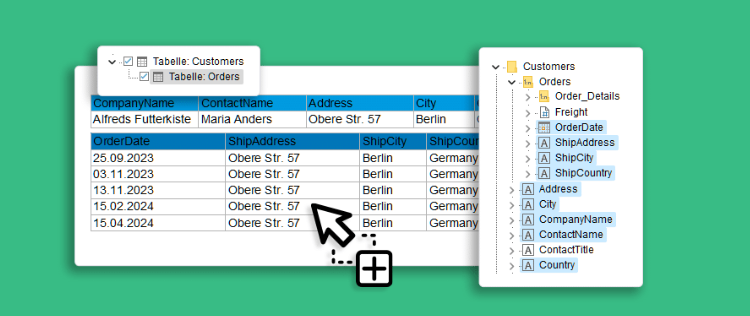
Supporting Multiple Report Containers
In version 20 we’ll introduce a brand new databinding mode for the .NET component which will replace the old one seamlessly. You won’t need to apply any code changes to profit from this new mode. However, under the hood things will be working quite different then.
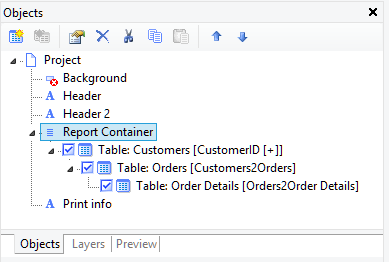
Combining the Report Structure and Object Tool Windows
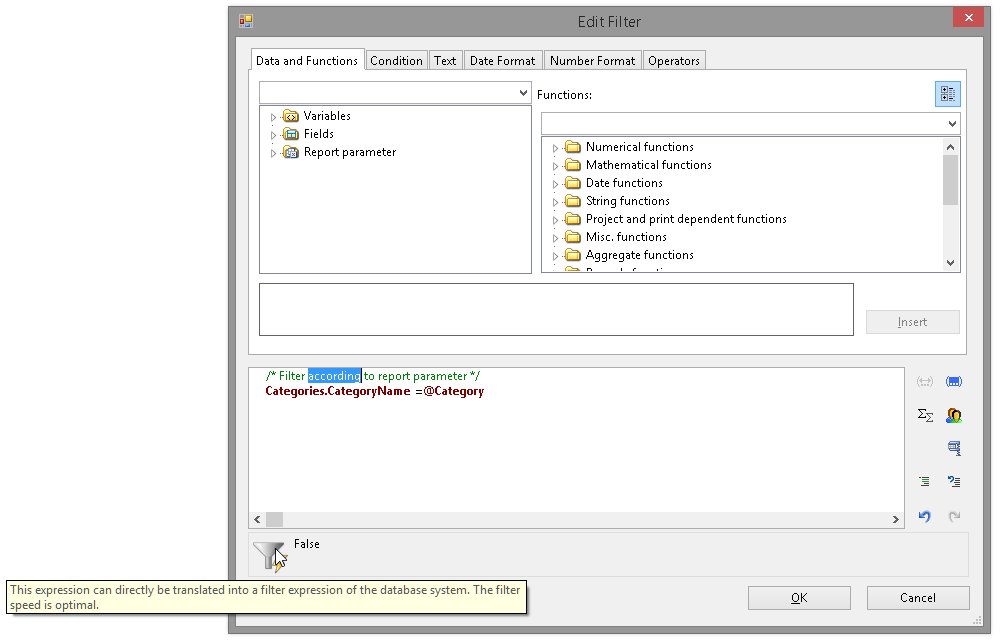
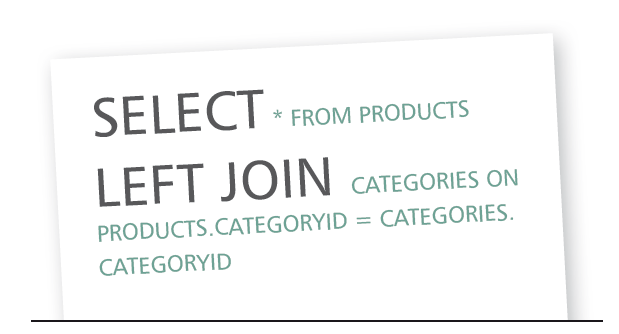
Filtering at Database Level
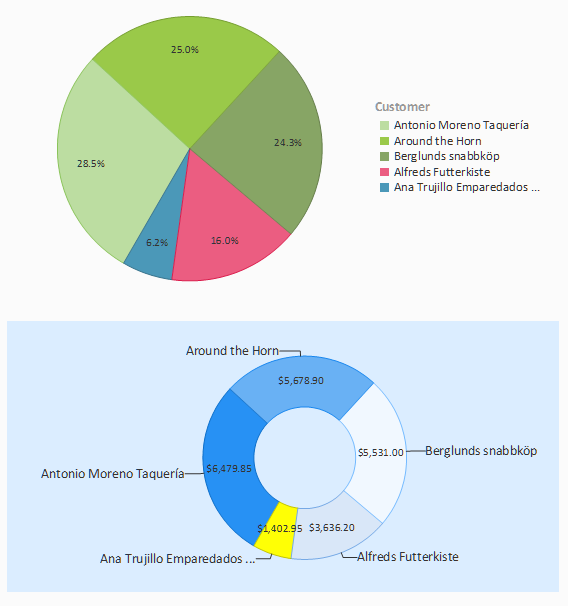
Drilldown via Report Parameters
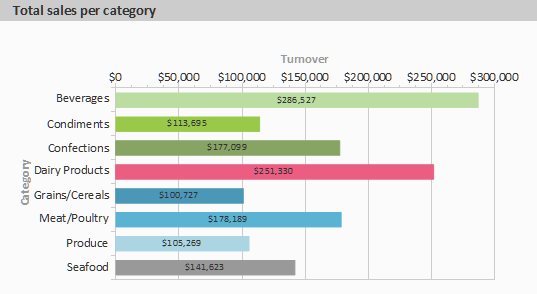
In addition to the drilldown via relations which we already had in the product for a couple of versions, you can now trigger a sub report that uses report parameters and set the parameter values depending on the item that you just clicked in the preview. This terrific feature works for pie/donut and bar charts, shapefile charts, table fields and crosstab contents. Of course, a drilldown report can contain another drilldown, too.
As with all the feature focus articles, keep in mind that this feature is not yet available in the current version, it will be part of List & Label 20.