For this reason we have added a user defined output mechanism to the Rscript workflow which simply defines which output is supposed to be created directly by the users script code and hence circumvents the automatic code generation.
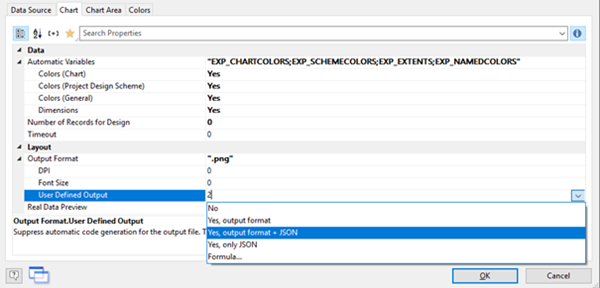
Usage is straightforward, we just need to tell in the first place what we intend to generate by our script and happily start writing the script code while making use of some common placeholders (see table below).
Supported placeholders:
| <!–RSCRIPTOUTFILE–> | Fully qualified filename of image file |
| <!–RSCRIPTOUTFILEDIR–> | Filename split in parts for convenience |
| <!–RSCRIPTOUTFILENAME–> | Filename split in parts for convenience |
| <!–RSCRIPTOUTFILEEXT–> | Filename split in parts for convenience |
| <!–RSCRIPTOUTFILENAMEBASE–> | Filename split in parts for convenience |
| <!–RSCRIPTCUSTOMTYPE–> | The selected user defined output type |
| <!–RSCRIPTEXPORTFORMAT–> | The current export format used if any e.g. “XHTML” |
| <!–RSCRIPTHEIGHT–> | Height of LL Object for Rscript |
| <!–RSCRIPTWIDTH–> | Width of LL Object for Rscript |
If you are only in need of a static but custom generated image, simply select “Yes, Output Format” and ensure that the file <!–RSCRIPTOUTFILE–> exists when done with the script.
A little more complex but potentially common use case of the custom output feature could be the export of HTML5 containing dynamic elements. Additionally, there might be the need to generate another static image for any other type of print e.g. by creation of screenshots.
Consider it as a passthrough mechanism for arbitrary HTML files into the XHTML exporter. You simply might choose “Output Format + JSON” in the configuration which will require you to generate an image as well as an additional JSON file specifying information about what else has been created and provided by the script.
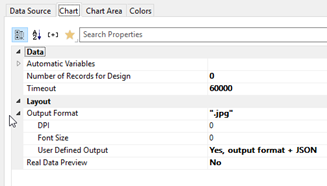
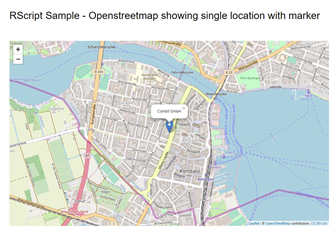
To keep things simple and less focus on chart content but the mechanism itself in this blogpost, let us create a simple map with a marker attached to combit’s location. Do not forget to switch off real time preview for performance reasons.
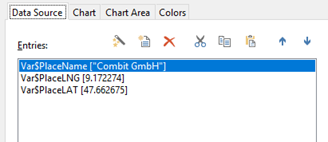
For a little flexibility we need some definitions and variables first.
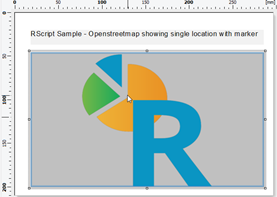
And finally have a look at the script code that will create the following output for XHTML Export but only shows the R Logo for any other type.
# library includes
library(plotly)
library(stringr)
library(jsonlite)
library(leaflet)
# change of working dir
savewd <-getwd()
setwd(“<!–RSCRIPTOUTFILEDIR–>”)
# just copy a dummy image if needed, which is the case for any type but “Only JSON”
# sloppy, but we don’t care for type here and just get it from our R homedir. LL will be happy with a different image type too.
if(!(<!–RSCRIPTCUSTOMTYPE–> == 3)){
file.copy(str_c(R.home(“doc”), “/html/logo.jpg”), “<!–RSCRIPTOUTFILE–>”, overwrite = TRUE)
}
# save html and JSON only if needed
if((<!–RSCRIPTCUSTOMTYPE–> > 1) && (“<!–RSCRIPTEXPORTFORMAT–>” == “XHTML”)){
# create the leaflet
p <- leaflet() %>%
addTiles() %>% # Add default OpenStreetMap map tiles
addMarkers(lng=Var$PlaceLNG, lat=Var$PlaceLAT, popup= Var$PlaceName)
# save html
fnWidget <- “widgets”
htmlwidgets::saveWidget(as_widget(p), file = str_c(“<!–RSCRIPTOUTFILENAMEBASE–>”,”.html”), selfcontained = FALSE, libdir = fnWidget)
# create and save the JSON
write(toJSON(data.frame(
group = c(“xhtml”, “xhtml”),
type = c(0,1),
flags = c(0,23),
name = c(str_c(“<!–RSCRIPTOUTFILEDIR–>”, “<!–RSCRIPTOUTFILENAMEBASE–>”,”.html”), fnWidget))),
str_c(“<!–RSCRIPTOUTFILENAMEBASE–>”,”.json”))
}
# back to work
setwd(savewd)
As you can see in this sample the HTML file is not created in a self-contained manner but uses a common widget folder. Installation of Pandoc would be required to also support self-contained output.
A simple JSON file is used to communicate with the exporter module consisting of one or multiple entries with group, type, flags and filename information. While the first entry refers to the generated html file, the second one references the common widget directory. A more detailed description concerning the flags can be found in the reference.
Simply by replacing some code in the # create the leaflet section, we now might create a multitude of different dynamic widgets being backed by the data that were provided by List & Label to the script in advance. Those again could be composed to either build dashboards containing multiple Rscripts or a single Rscript making use of R specific subplot or dashboard features.
