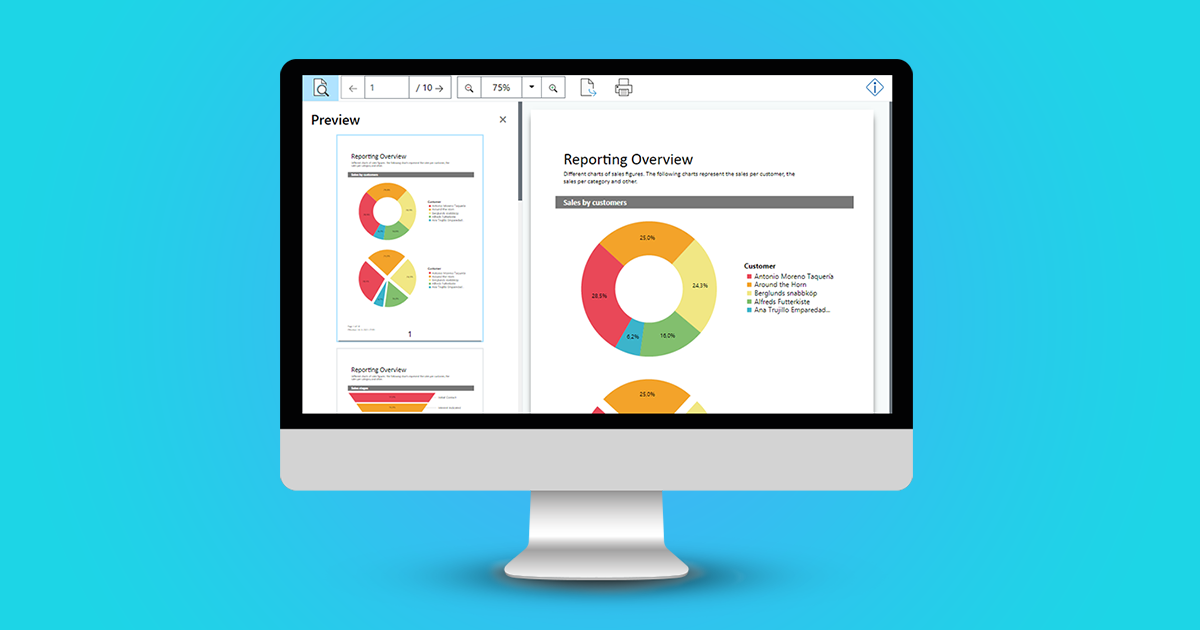
Building a full reporting system for WinForms & WPF with List & Label

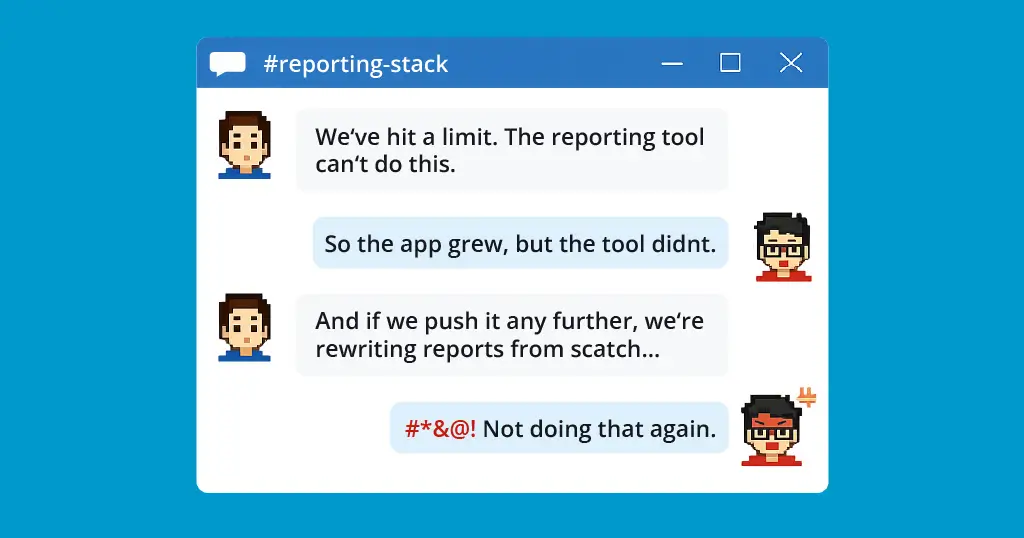
Desktop business applications eventually hit the same reporting problem: users want new reports, PDF exports, Excel output, print previews, and layout changes without waiting for another release. For development teams, that usually means a choice between piling up custom export code or building a reporting framework from scratch. List & Label offers a more practical option: embed reporting directly into your WinForms or WPF application while keeping control of your data, permissions, and user experience. This guide shows how to integrate it in a way that is practical, scalable, maintainable, and built for real-world line-of-business software.