If you add a new chart, you can now choose “Rscript” as chart type:
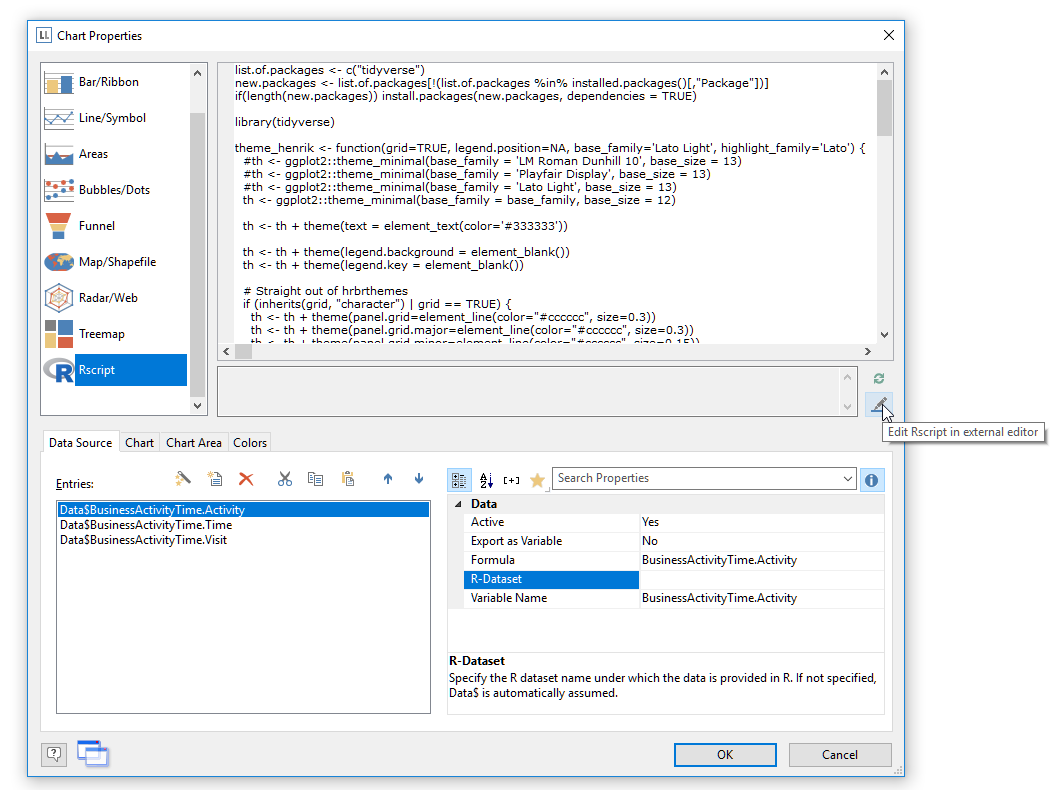
The Rscript chart dialog offers a huge code editing control where you can write your Rscript. It also has a nifty integration for RStudio or your favorite Rscript code editor – the code can freely be swapped between LL and RStudio. Last, but not least, you can preview the result of your script at any time. Let’s do a quick walkthrough.
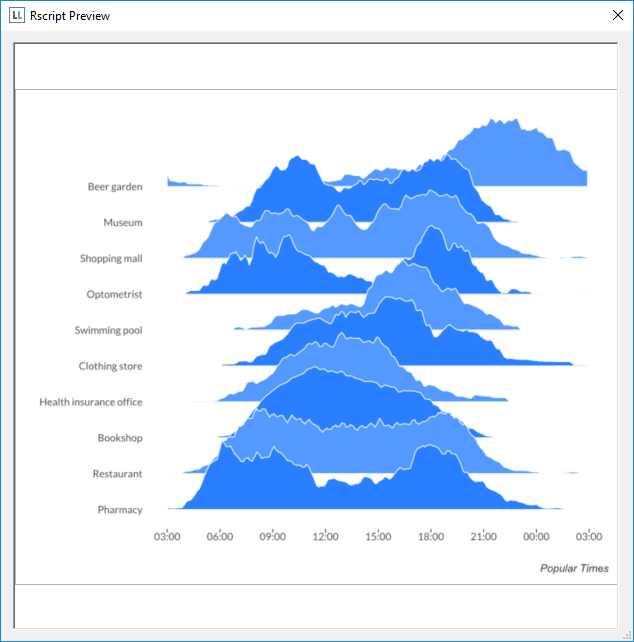
On the “Data Source” tab you can choose the available data for your script. The following example shows how a Ridgeline Plot could be used as a suitable data source. This visualization type allows to compare the values of multiple categories e.g. by time. The result is similar to Google’s “Popular Times” chart. Here’s what it looks like for my favorite Irish Pub here in Constance:
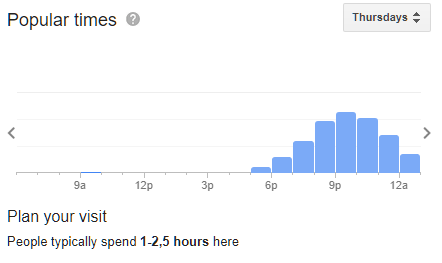
However, a Ridgeline Plot typically uses a continuous envelope line and compares different locations underneath each other. A good starting point is a google search for a suitable script – there are gazillions of Rscripts out there. In this case I found a template on GitHub here, thanks @hnrklndbrg for sharing this great repro of visualizations.
The raw data for the plot looks like this:
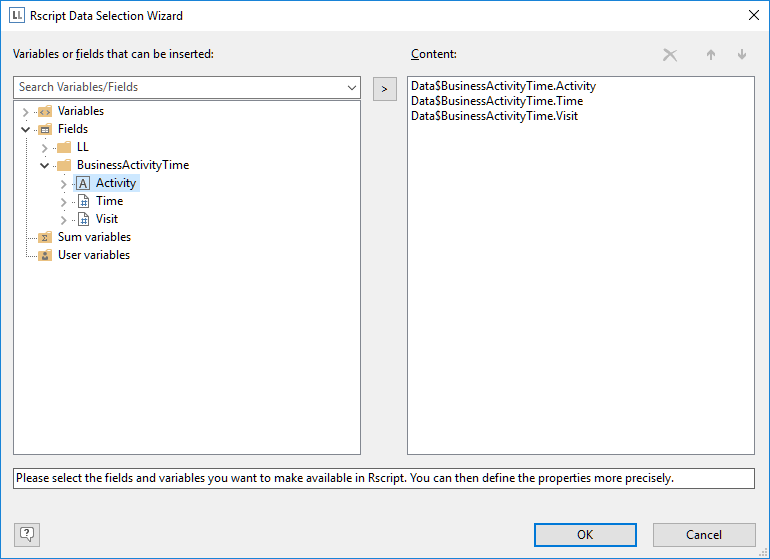
where the first column is the activity, the second is the number of minutes since midnight and the third is a measure for the number of visits in some obscure metric. You can easily make the data available to the Rscript chart by adding the fields to a new dataset – there’s even a custom wizard to make life easier.
For developing and debugging advanced scripts it’s highly recommended to install RStudio. After copying the script to the code window, click on the “Edit” button to open it in RStudio. Note the automatically generated code for accessing the data:

Don’t mess with this part of the code or things will badly break ;). If you run the line that populates the dataset you can see that your data safely arrived on the other side:

List & Label automatically converts the data to a CSV file that is created behind the scenes and passed to the Rscript. The rest is an easy exercise – just replace the data source from the GitHub sample script with our actual data. We’ll ship this example with version 24 if you want to see for yourself. After saving the edited script in Rstudio and returning to the Designer, you’re asked if you want to accept the external changes:
You really, really will want to do this most of the time. Click the preview button to get an impression of the new Ridgeline chart:
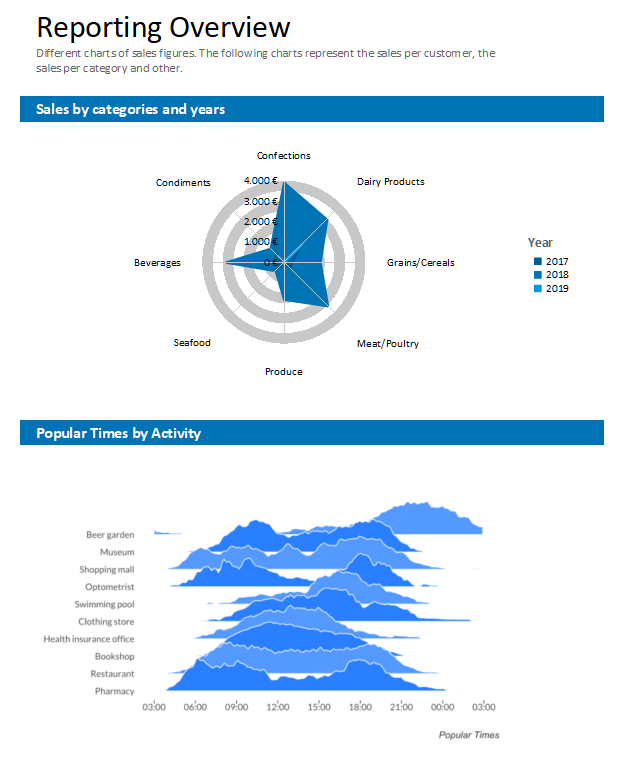
Of course, this visualization type can now float freely within your more complex dashboard report:
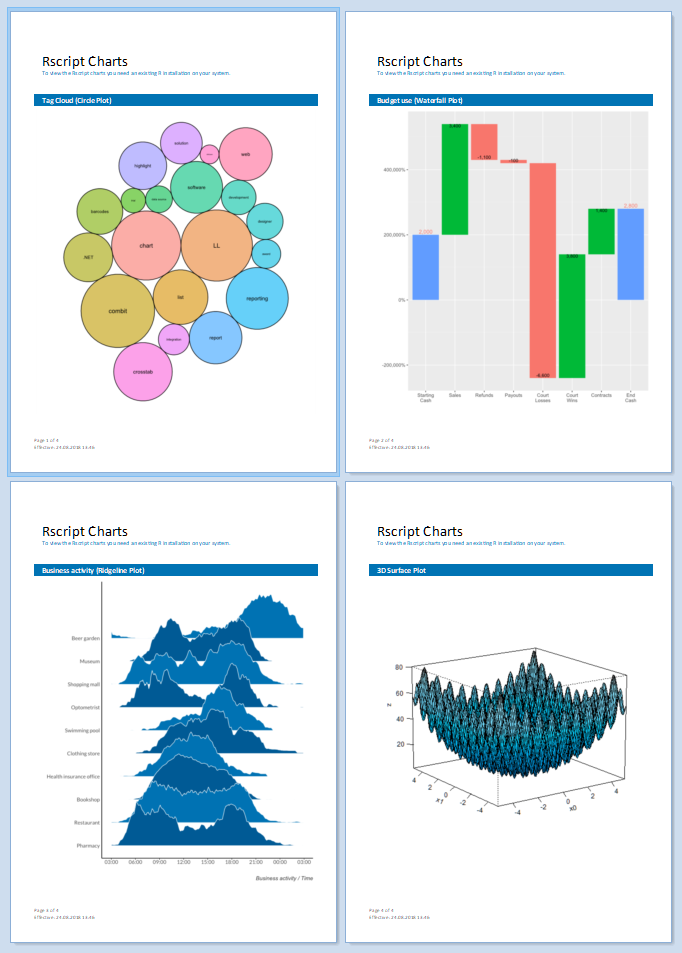
We ship a demo project for this feature that shows how to create a Tag Cloud, a Waterfall Plot, a Ridgeline and a Surface Plot, all of which were previously unsupported in List & Label.
While you admittedly have to be a bit tech savvy in order to make use of this new feature, it’s the ultimate answer to any missing chart visualizations. I’m really proud of this new, deep integration and look forward very much to seeing what you’ll end up using it for

